
Hadoop - Netflix Prize
Problem Context
The Problem:
Netflix is the largest online DVD rental service, offering flat rate rental-by-mail and online streaming to customers in the United States(Wikipedia). The goal of the NetFlix Prize competition is to improve the accuracy of the prediction algorithm to more accurately project how individual subscribers will rate a movie based on intelligent predictions derived from finding similar users and movies in the database. This problem has been challenged to the public by Netflix themselves, available at: http://www.netflixprize.com/. Netflix already employs a movie recommendation system called Cinematch (SM) to recommend movies to current customers based on their movie renting and rating histories. The Netflix challenge is to build a recommendation system that can make recommendations with an improved accuracy of 10% over the Cinematch (SM) system as it was used by Netflix in 2006.
The Intended Customer:
Our intended customers will be the Netflix Corporation, with the goal of integrating the winning system with the current recommendation system.
Technology Challenges:
- Volume of Dataset: The provided Netflix Dataset is a massive set of user/movie/rating combinations that spans over 2 gigabytes on disc. Reorganizing this massive amount of data via processor intensive algorithms took much consideration and care.
- Limitations in Dataset: The provided Netflix Dataset is a subset of data from the Netflix user/rating database which is by no means the complete dataset. This subset is limited not only by the time period selected by Netflix, but also by the users and movies that Netflix chose to incorporate into the dataset. What we believe, as relevant data, required for such a system to be accurate, was not present in the dataset. Data such as Genre and Actors were not included in the dataset.
Business Challenges:
Since this competition started in 2006, many teams have attempted to solve the problem. This puts our team at a disadvantage since we do not have the familiarity with the dataset nor the years of experience that our competitors have. Because of this, our initial RMSE values should be significantly less than other competitors.
Problem Objective
Our objective is to build a movie prediction system using the Map/Reduce programming model as implemented by the Hadoop project which can be submitted as an entry in the Netflix Prize Challenge.
Literature Review
As of now, according to the Netflix Leaderboard statistics, it is said that 47,653 contestants have taken part in this challenge in the form of 39,132 teams from 182 different countries.
Out of all these they have received 339,551 valid submissions from 4,540 different teams.
The various teams working on the Netflix Prize Challenge include dedicated Researchers, part time software developers, Family members and freelancers. Very few of these teams have proper funding from other organizations. The methodologies or approaches used include various mathematical approaches and software implementations. We have seen people using techniques like matrix factorization, Clustering, Anchoring, Neural nets, Gaussian factorization, regression models etc. We also observed that few teams have the approach of combining the predictions of many other teams.
Description of the dataset:
The dataset provided by Netflix is 2.1 Gigabytes and distributed in files in the form given below:
- Training data set: This is a directory containing 17,770 files with a single file per movie. The first line of each file contains the movie id followed by a colon and each subsequent line in the file corresponds to a rating from a customer, as shown below:
Training_set1.txt...Training_set17770.txt:
[CustomerID,Rating,Date]
· MovieIDs range from 1 to 17770 sequentially.
· CustomerIDs range from 1 to 2649429, with gaps. There are 480189 users.
· Ratings are on a five star scale from 1 to 5.
· Dates have the format YYYY-MM-DD.
1: 				[Movie 1 of 17770]
1080116, 3, 2006-04-17		[CustomerID,Rating,Date]
12, 5, 2003-07-07		[CustomerID,Rating,Date]
...
- Movie Titles dataset: This is a dictionary file which consists of information about each movie i.e the movie id followed by year of release and title of the movie.
Movie_titles.txt
...
10120,1982,"Bladerunner"
...
17690,2007,"The Queen"
- Qualifying Dataset: The first line is the movie id followed by a colon and subsequent lines consist of customer id and the date rated.
Qualifying.txt
MovieID1:
CustomerID11,Date11 [rating?]
CustomerID12,Date12 [rating?]
...
MovieID2:
CustomerID21,Date21 [rating?]
CustomerID22,Date22 [rating?]
The Algorithm:
We used the Map Reduce programming model with our own prediction algorithm to solve the problem. Before running the algorithm the dataset needs to be customized into another format including additional data that can be mined or computed from the existing dataset.
Step 1. As our first step we used map/reduce to input the raw dataset and produce a new dataset containing:
<MovieID firstDateRated, lastDateRated, yearOfProduction, totalNumRatings,
avgRating, movieTitle>
Legend:
MovieID: Our key in the dataset. A unique Id assigned to each movie present in the dataset.
firstDateRated: The date on which this movie was first rated by any user.
lastDateRated: The date on which this movie was last rated by any user.
yearOfProduction: The year which this movie was produced.
totalNumRatings: Total number of ratings received by a movie.
avgRating: The average of all the ratings received by a movie.
movieTitle: Title of the movie.
This step will give us the ability to make predictions about each movie independently.
Step 2. As our second step we use map/reduce to input the raw dataset and produce a second dataset containing:
<CustomerID ratingCount, ratingAvg, ratingDelay, movieRatingList>Legend:
CustomerID: Our key in this dataset. A unique Id assigned to each user present in the dataset.
ratingCount: The number of ratings given by this user.
ratingAvg: The average of the ratings given by this user.
ratingDelay: The delay in years between the year of production of the Movie and the date that the user rated it.
movieRatingList: A list of the
This step will give us the ability to make predictions about each user.
Step 3. Our third step is the actual prediction algorithm that predicts a rating for a given user and movie.
It is based on following concept.
We visualize our dataset derived from first step to be divided into 4 quadrants as shown in fig 1.
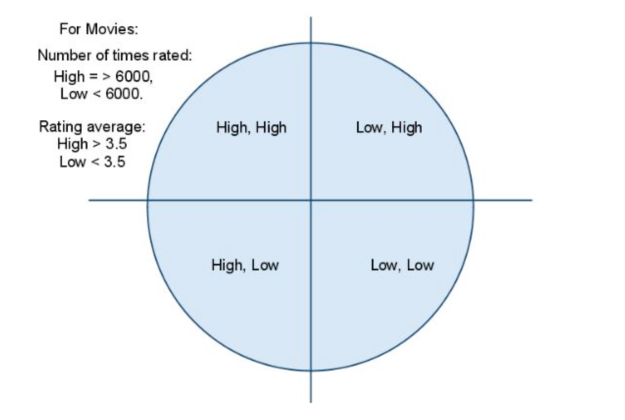
Fig. 1. Movie Quadrants.
1st Quadrant: First quadrant consists of those movies which have received high number of ratings by users and also have been rated very highly. It can be predicted that these movies have a good probability of receiving a high rating by the targeted user.
2nd Quadrant: Second quadrant consists of movies that have received high number of ratings by users but have been rated very low. It can be predicted that these movies have a good probability of receiving a low rating by the targeted user.
3rd Quadrant: Third quadrant consists of movies that have received low number of ratings by users but have been rated very highly. A definitive conclusion about this set of movies and predicted ratings cannot be made.
4th Quadrant: Fourth quadrant consists of movies that have received low number of ratings by users and have been rated very low. A definitive conclusion about this set of movies and predicted ratings cannot be made.
To arrive at a conclusion for the movies which fall in quadrant three and four, we make use of our dataset derived from the second step.
We visualize our dataset derived from second step to be divided into 4 quadrants as shown in fig 2.
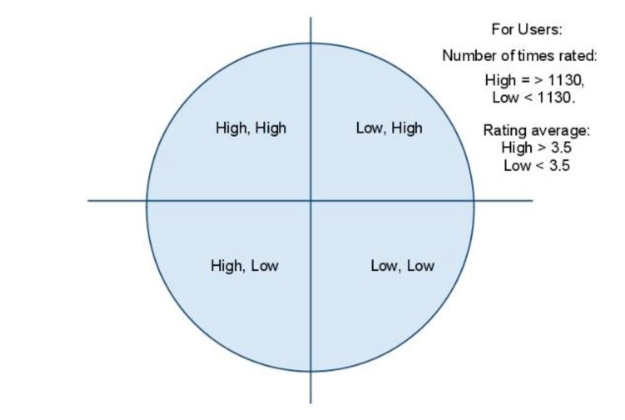
Fig. 2. User Quadrants.
1st Quadrant: First quadrant consists of those users who have watched high number of movies and also have a high average rating. It can be concluded that the users in this quadrant have a higher credibility when it comes to rating a movie.
2nd Quadrant: Second quadrant consists of those users who have watched high number of movies but have a low average rating. It can be concluded that the users in this quadrant do not like the movies they have watched, or in other words, they are strict movie critics.
3rd Quadrant: Third quadrant consists of those users who have watched low number of movies but have rated them highly. It can be concluded that the users in this quadrant are occasional movie watchers.
4th Quadrant: Fourth quadrant consists of those users who have watched low number of movies and have rated them low. It can be concluded that the users in this quadrant do not give credible ratings.
The derived dataset from clusters 2 and 3 of the Movie based output from Netflix1 are then fed into a Mapper in order to create the list of user/rating pairs for each given movie. The weighted average for each movie is then computed based on a weighting algorithm applied to the user/rating list based on the individual users quadrant calculated from the output of Netflix2. The weight algorithm employed is as follows:
1st Quadrant - 50%
2nd Quadrant - 25%
3rd Quadrant - 15%
4th Quadrant - 10%
This is done to make sure that the users with higher credibility in rating movies have a higher say in the prediction of the movie rating.
Implementation:
Netflix1:
The Netflix1 program was written to produce statistical information about each movie in the dataset. It took the entire dataset as input and produced the first date rated, last date rated, total rating count and average rating for each movie in the dataset. Below is a graph of the results:
The LongTail concept:
The graph shown below is drawn from the output of Netflix1, which resembles the Long tail concept.
The long tail is the name for a long-known feature of some statistical distributions, also known as heavy tails, power-law tails, or Pareto tails.
The phrase "The Long Tail" was first coined by Chris Anderson, which Wikipedia defines as: Given the high freedom of choice the market which consists of a large population of customers, will create a certain degree of inequality by favoring the upper 20% of the items ("head") against the other 80% ("long tail"). This is known as the Pareto principle or 80Ð20 rule.
Netflix1 final output:
<MovieID firstDateRated,lastDateRated,numberOfRatings,averageRating>
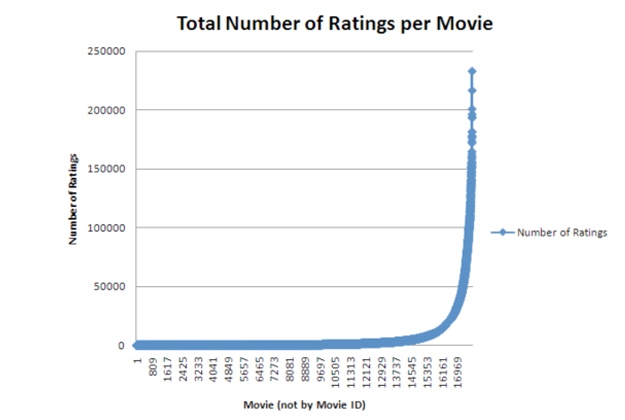 The graph above demonstrates the 80-20 rule when we look at statistical information about the number of ratings that each movie has received.
We chose the following break points for the algorithm based on the graph above:
The first break will be at 1130 ratings.
The second break will be at 3.5 average rating.
Netflix2:
The Netflix2 program was centered around the Users in the dataset. It calculated the total number of rated movies, the overall average rating and the rating delay (the delay between the production date of the movie and the movie rating date) for each user in the dataset. These statistics proved to be very useful in the choosing of the breakpoints for the algorithm. It allowed us to make adjustments to the algorithm so that the clusters we produced were a proper size and highly correlated.
From the output of the Netflix2 program, we chose the break points to be:
The first break will be at 209 rated movies.
The second break will be at a 3.5 average rating.
Netflix final:
The Netflix Final program is where the algorithm was actually implemented. The output from the Netflix Final is what will be submitted to Netflix as our official entry to the Netflix Prize Competition. The Mapper for the Netflix Final program took the movie list subset as defined by the movies in quadrants 2 and 3 as a distributed cache file. The mapper then extracted all the user ratings for each movie in the distributed cache file, and output it to the reducer. The reducer took the user quadrant list as computed by Netflix2 as a distributed cache file. It applied the weighting system of the JVM algorithm to each rating for each movie based on the userÕs quadrant location as provided by the file in distributed cache. The output from the Netflix Final program was a list of each movie and new predicted rating.
Conclusion:
The calculation of RMSE makes the conclusion of the project.
RMSE:
An example of steps used to calculate the RMSE:
Step 1:
Predicted Rating         Actual Rating         Difference
----------------         -------------         ----------
         2                     5                    3
         4                     3                    1
         3                     2                    1
         1                     4                    3
         2                     5                    3
Step 2:Squaring and averaging the "Difference":
(3^2 + 1^2 + 1^2 + 3^2 + 3^2) / 5 = 29 / 5 = 5.8Step 3:
Calculating the RMSE:
RMSE Value = Sqrt(5.8)
We calculated the RMSE of our predicted ratings by using the combination of probe dataset and training data set manually and the result on a small set of movies is:
0.457
For the accurate RMSE on the whole set the code will be submitted to Netflix.
Future improvements
The data used to run the current algorithm was based on the number of ratings/users and the average of ratings given to/by users/movies. To improve upon the given system additional layers of information can be added like making use of dates of publishing of the movies or the dates on which the users watched a given movie. Other correlations using movie titles to derive information like sequels and prequels and the rating received by them can also be used to reflect on the prediction. To go on further it is also possible to derive a data set from other movie rental or information sites like Imdb to make use of additional information like genres that have not been provided by Netflix.
Additionally, we have started writing another program, Netflix4, which calculates the weighted average rating for each movie every month over the span of the movies ratings in the dataset. We have not yet run this algorithm as we first need to rework the input dataset into a consolidated smaller file hierarchy as the overhead required to create 17,770 mappers every time we wish to run the calculation is slowing down our compute times more and more as the algorithm increases in size.